
DOE CSGF Application Statistics
- Mar 30, 2017
- 4 min read
About the Fellowship
The Department of Energy's (DOE) Computational Science Graduate Fellowship is among the most prestigious awards for which a graduate student can apply. The award, available to students studying subjects such as the physical sciences, engineering, applied mathematics and computer science, provides four years of financial support in the form of a $36,000 yearly stipend, full payment of tuition and fees, and an additional yearly academic allowance. On top of that, students are required to complete a practicum at a national lab and attend yearly conferences where all recipients and many alumni gather to discuss the computational science.
For those interested in applying, the application is usually due mid- to late-January and requires the submission of a number of short essays, 3-4 letters of recommendation, transcripts and GRE scores. While I hope to compose a post describing my approach in writing the essays and preparing the application, I will direct those who are interested in finding out more to the fellowship's website for now.
At the time of my writing of this post, however, I submitted my application months ago and am eagerly awaiting a call or email informing me of my status. So, in the same spirit as students approaching finals week who calculate their potential final grade using every possible scenario, I've turned to statistics in an attempt to assuage my anxiousness and provide some information for others looking for this information!
Data on the CSGF is difficult to find, but I stumbled across a DOE presentation from 2015 and a report from 2011.
Number of Applications and Awards
The figure below was compiled mainly from the presentation mentioned earlier. Additionally, I added the data point for 2016 showing the number of awards based on the list of students starting their first year of the fellowship according to the GRFP website.

One prominent feature we can see from the data plotted here is the variability in the number of awards given. This has been exaggerated in recent years with 2013 and 2015 providing the historically lowest number of awards contrasting against 2014 and 2016 where extremely high numbers of fellowships were awarded.
Another interesting feature is seen in the trend of applications as a function of time. Until 2012, the number of applications had increased nearly monotonically. Following that year, however, a sharp decrease in the number of applications can be seen. While I was unable to find data for 2016, this seems to be promising for those of us applying for the award this year.
In summary, a few key statistics:
Average Number of Applications: 416
Average Number of Awards: 17
Acceptance Rate
While we can easily calculate the average acceptance rate over the given time period to be 4.88%. There is an extreme outlier in 2012, with the record low in number of applications but the second highest number of fellowships awarded - if we disregard this data point, the time-averaged acceptance rate drops approximately 1% to 4.05%. As a comparison, the NSF GRFP reports here that in 2017 approximately 13,000 applications were received with 2,000 fellowships rewarded, corresponding to an acceptance rate of ~15%.
For further illustration, the plot below shows the acceptance rate as a function of time. We can see that it dropped steadily until 2013 where it reached a minimum of approximately 2%. This drop over the first ten years can be accounted for by the steady increase in the number of submitted applications. In 2013, there was a decrease in application number, but a corresponding decrease in awards.
It appears that, for those of us applying this year, the acceptance rate should give us greater hopes than it has in years past, though it is still lower than the acceptance rate for the NSF GRFP.

Breakdown by Discipline
Now for the data I thought was most interesting! The report I mentioned earlier contained a very detailed breakdown of the program. This included statistics on the research area and employment sector for application reviewers, employment information for fellows, and what I compiled below, a breakdown of applications and awards by reported research area.
In the plot below, each color refers to the acceptance rate of each research area while the black dashed line is the average acceptance rate. Note that I left out statistics on social sciences applications because there are so few applications that when one is awarded, the acceptance rate can reach 100% (meaning there was one applicant and one award).
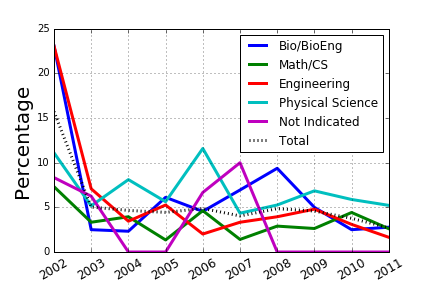
Since this data is a bit old (six years), what I find most interesting is to see the areas that tend to have acceptance percentages consistently below or above average. We can first note that the physical sciences (cyan) has a consistently high acceptance rate, only falling below the average rate for the first year of included data. Biology and Bioengineering were consistently lying above average from 2005-2008, but has recently aligned with the average.
Surprising to me was that engineering majors are slightly below average. I think this can be explained by the number of applications submitted by engineering students. For example, in 2011 there were 243 engineering applications and 115 physical science applications. Both disciplines routinely are awarded between 4 and 8 fellowships during this time period, thus the difference in acceptance rate seems to be due to the number of engineering applications.
Another trend many people may not expect, if they haven't thoroughly researched the award, is the systematically low acceptance of applicants studying applied math or computer science. I speculate that this is because the award is focused on scientific computing. From my understanding, math and computer science majors must have a very specific research focus that is truly centered in fundamental science or engineering.
Conclusion
While I don't know that these statistics will directly impact the way someone writes their application, I hope that they will help relieve some of the anxiety applicants might feel while waiting for the final results! In my opinion, the results are what one would expect. This is a competitive fellowship with a large number of applicants and a relatively small number of fellowships available.
Good Luck and let's hope we hear back soon!


Comments